What's here
A collection of blog posts, visualizations and quick tips in Python and JavaScript. Everything is free for non-commercial use — just credit the site.
Blog Posts
Long-form, illustrated deep dives. Theory, intuition, plots, animations and open-source code.
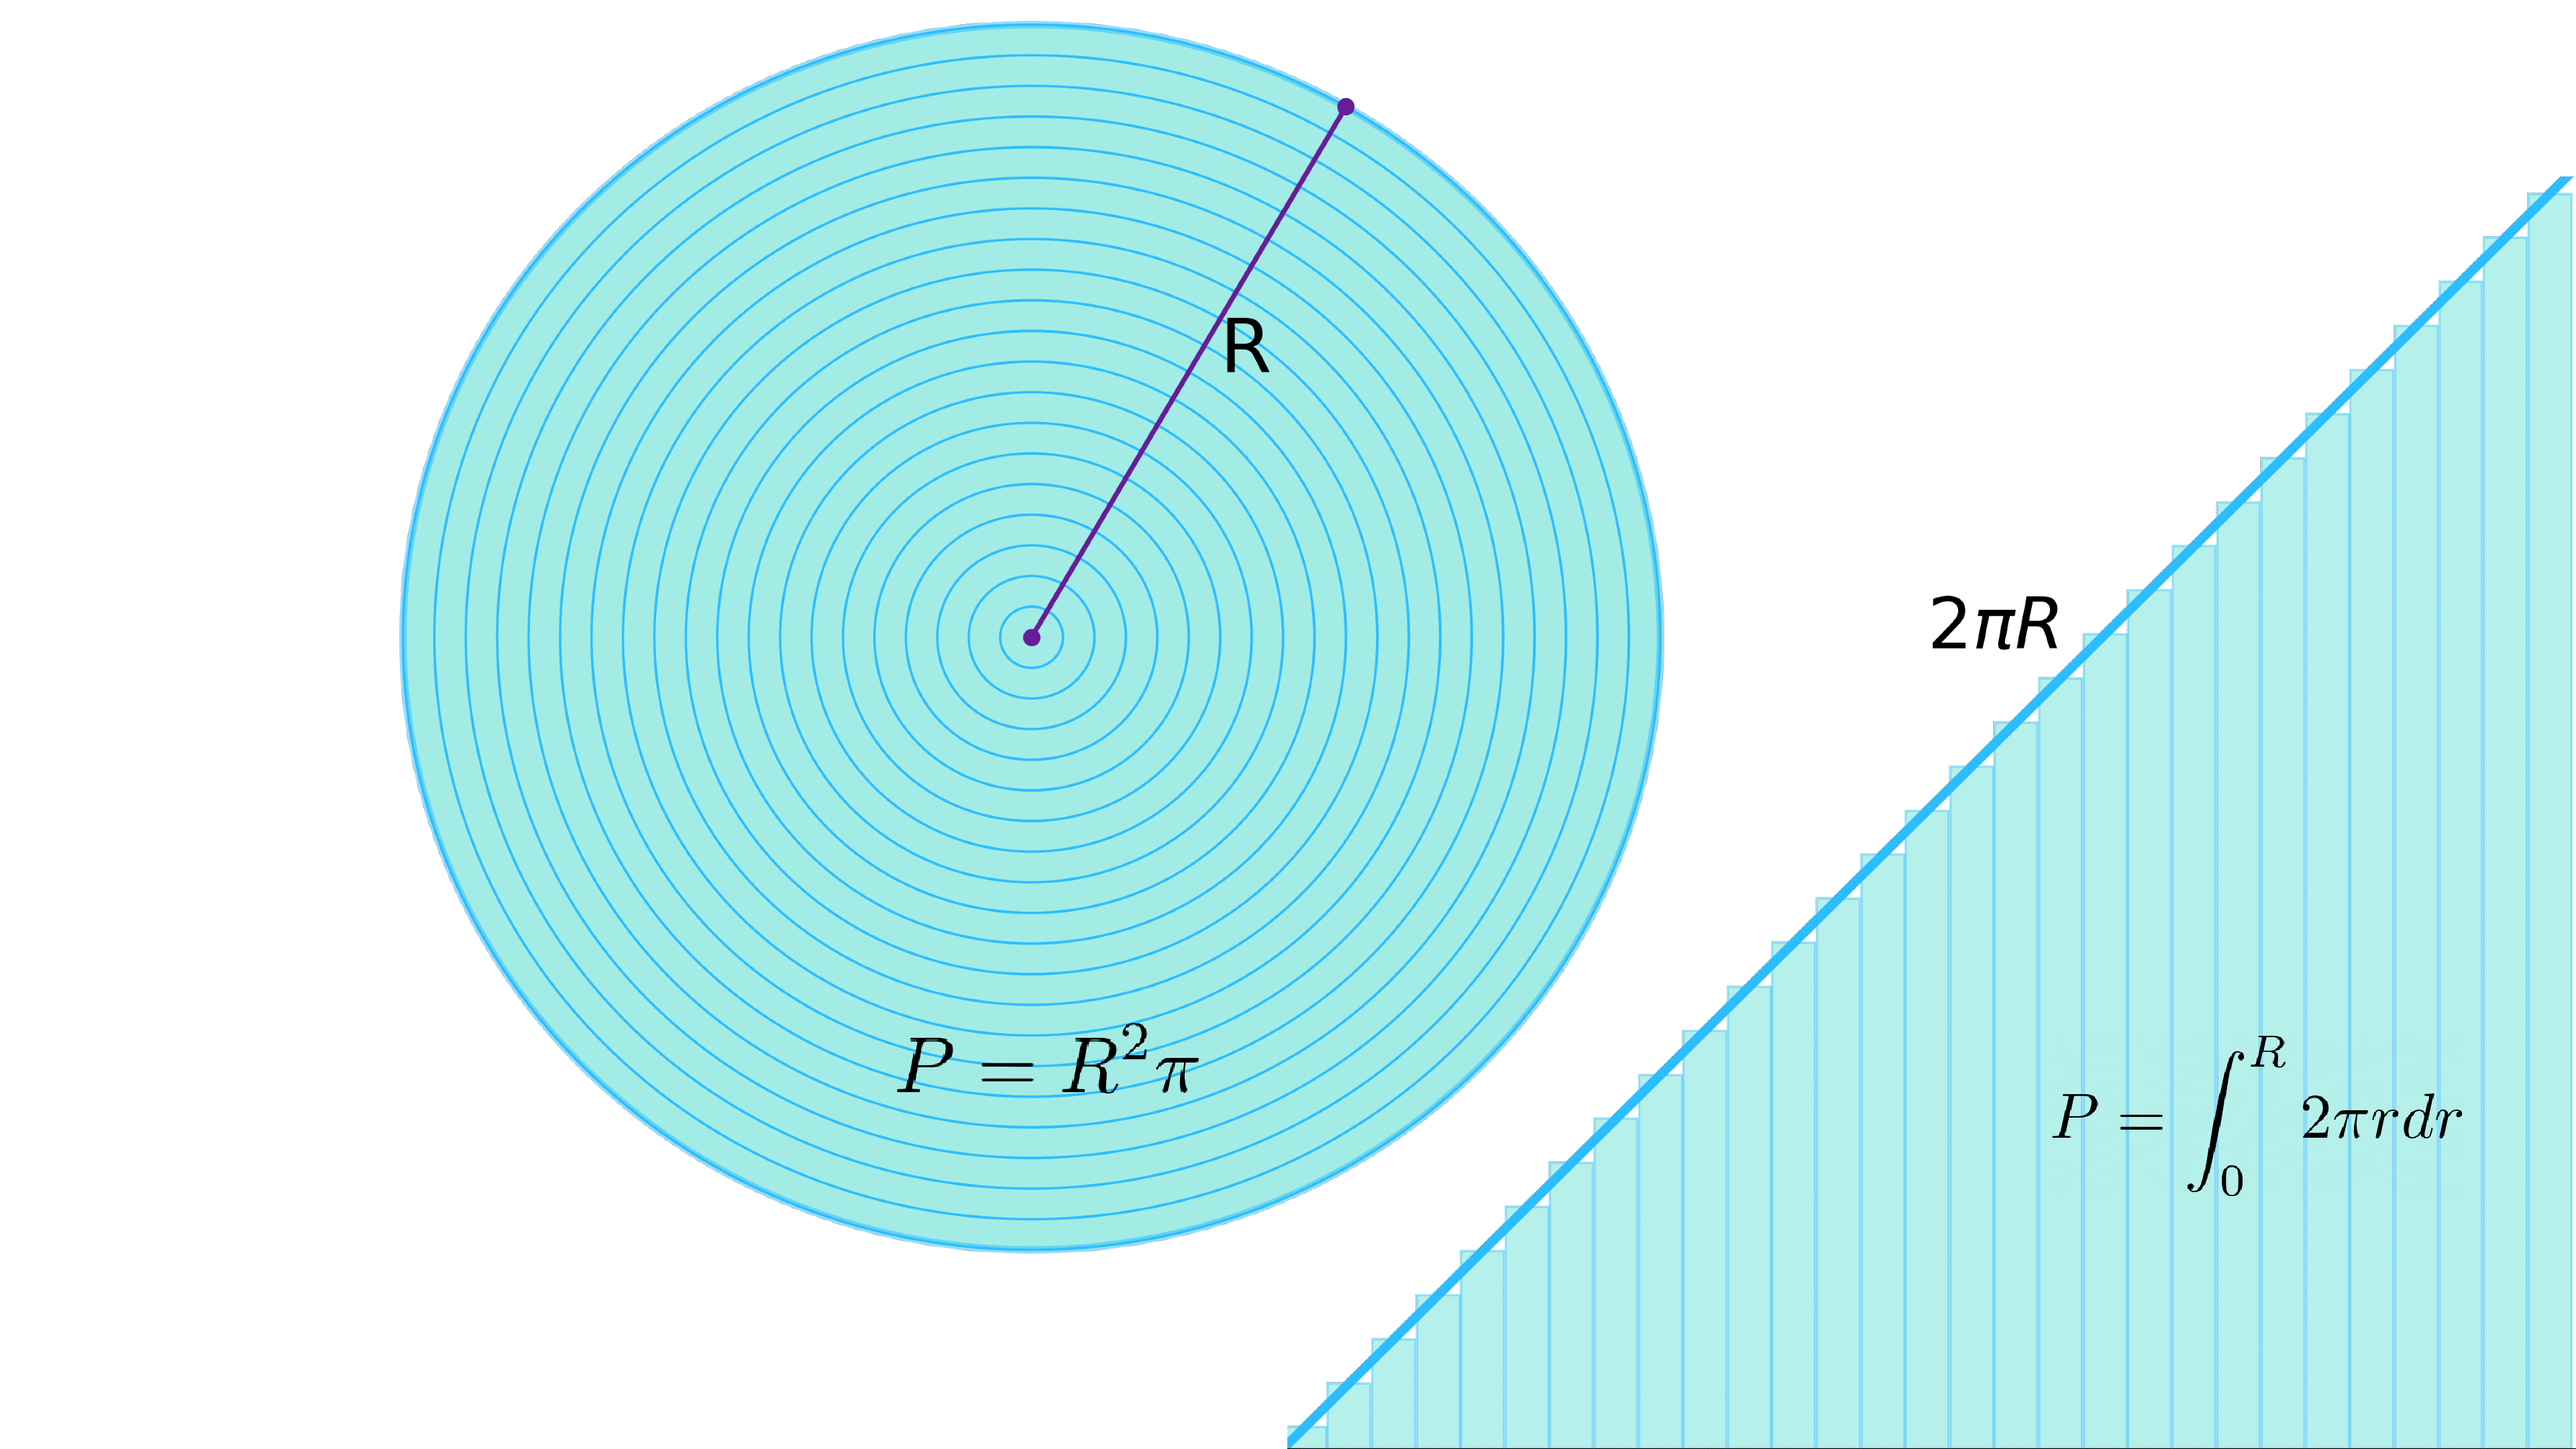
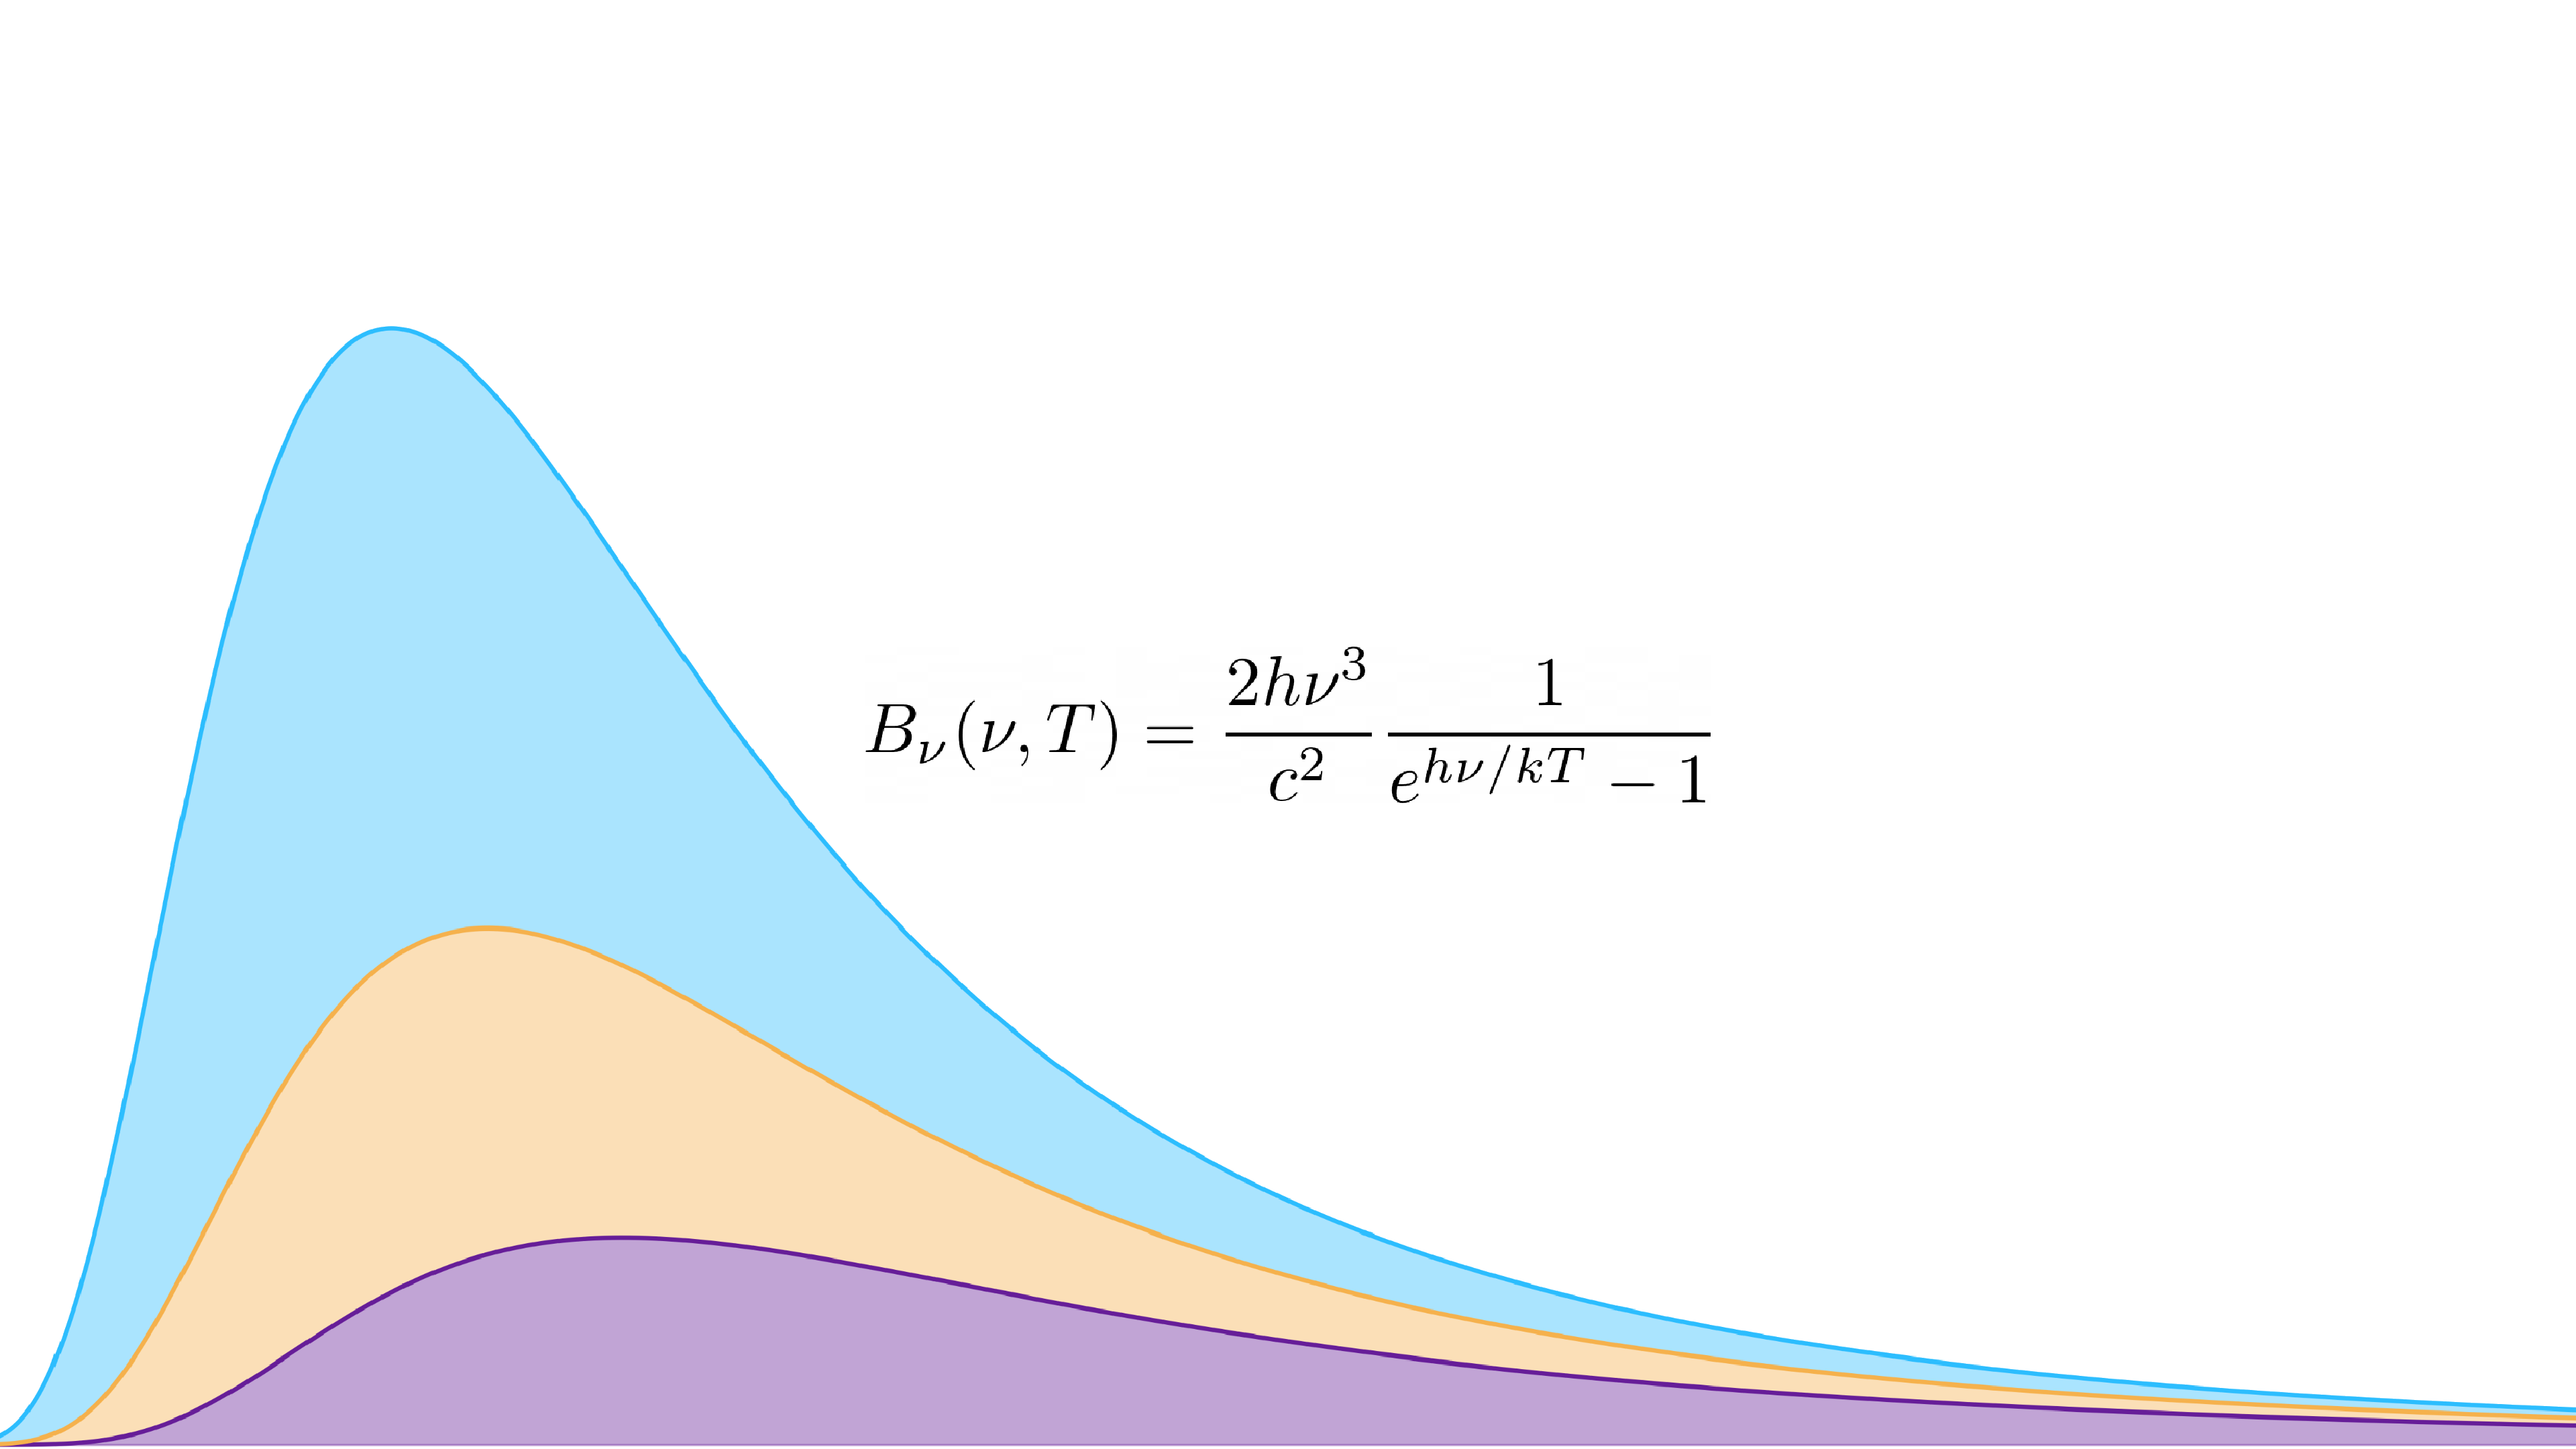
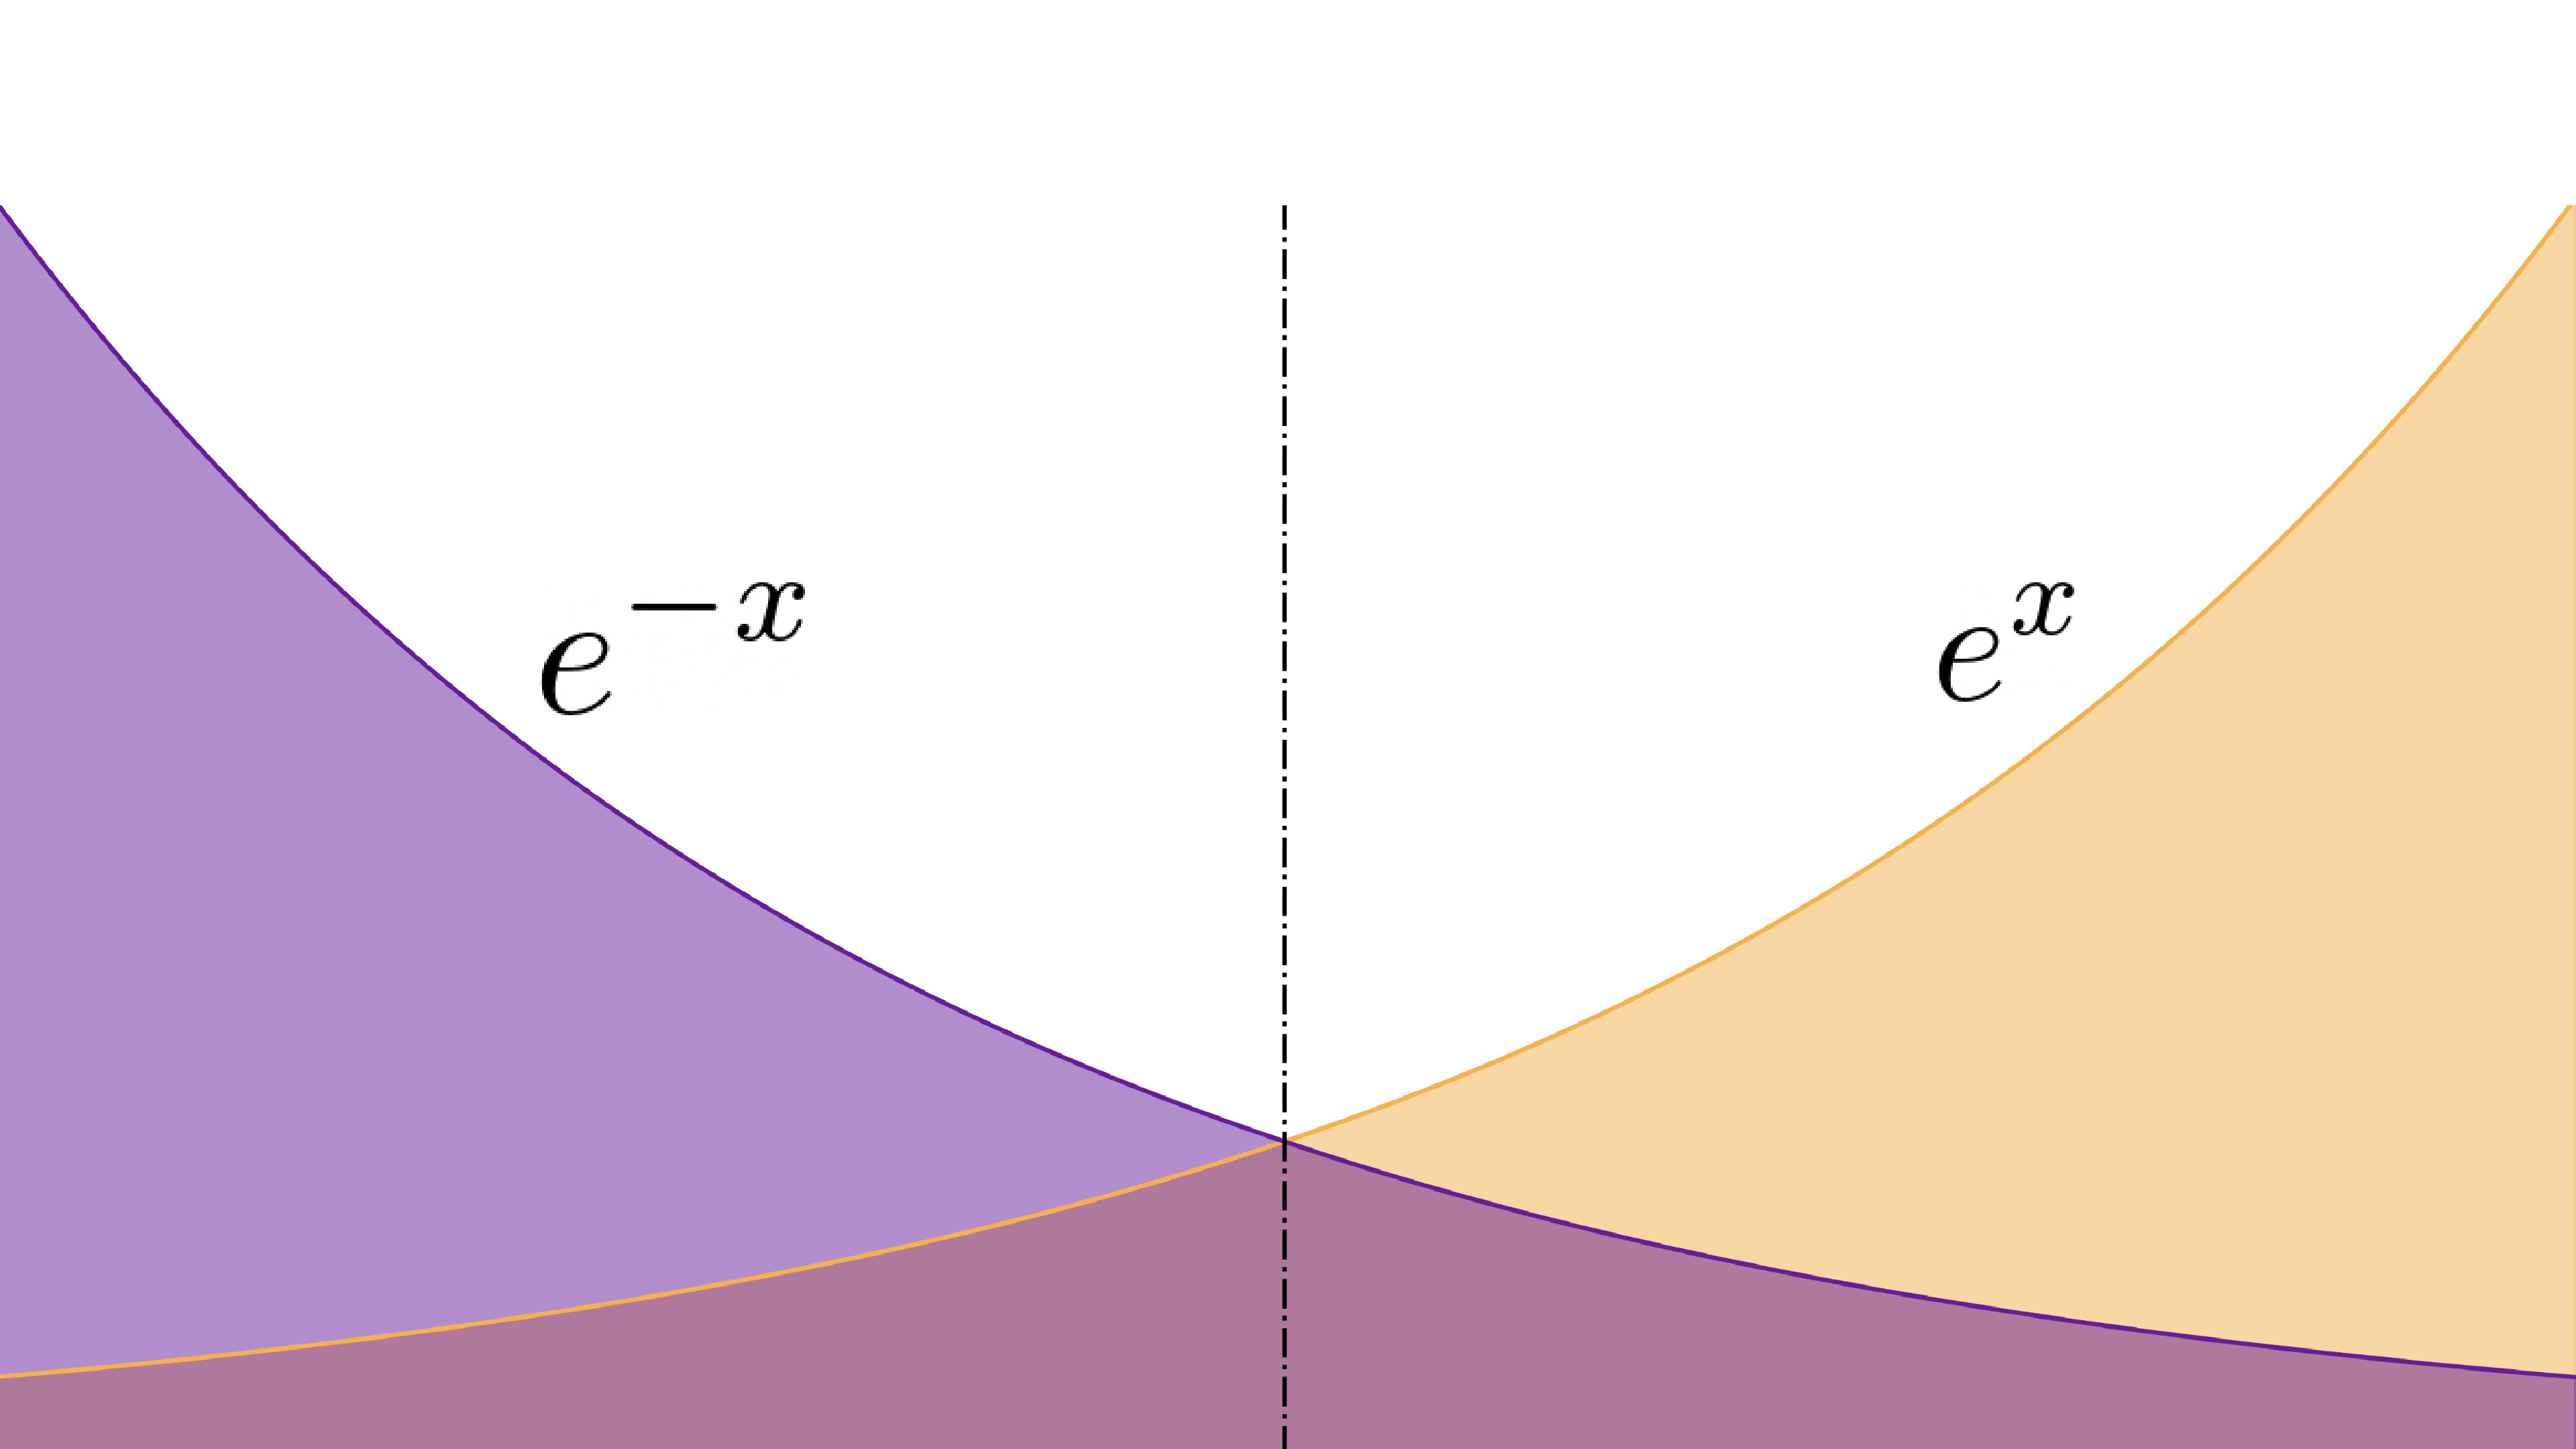
Visualizations
Atomic, ready-to-use visualizations of scientific and mathematical concepts.
Quick Tips
Bite-size data science and programming tricks — perfect for a coffee break.
Popular blog posts
A few favourites from the archive.
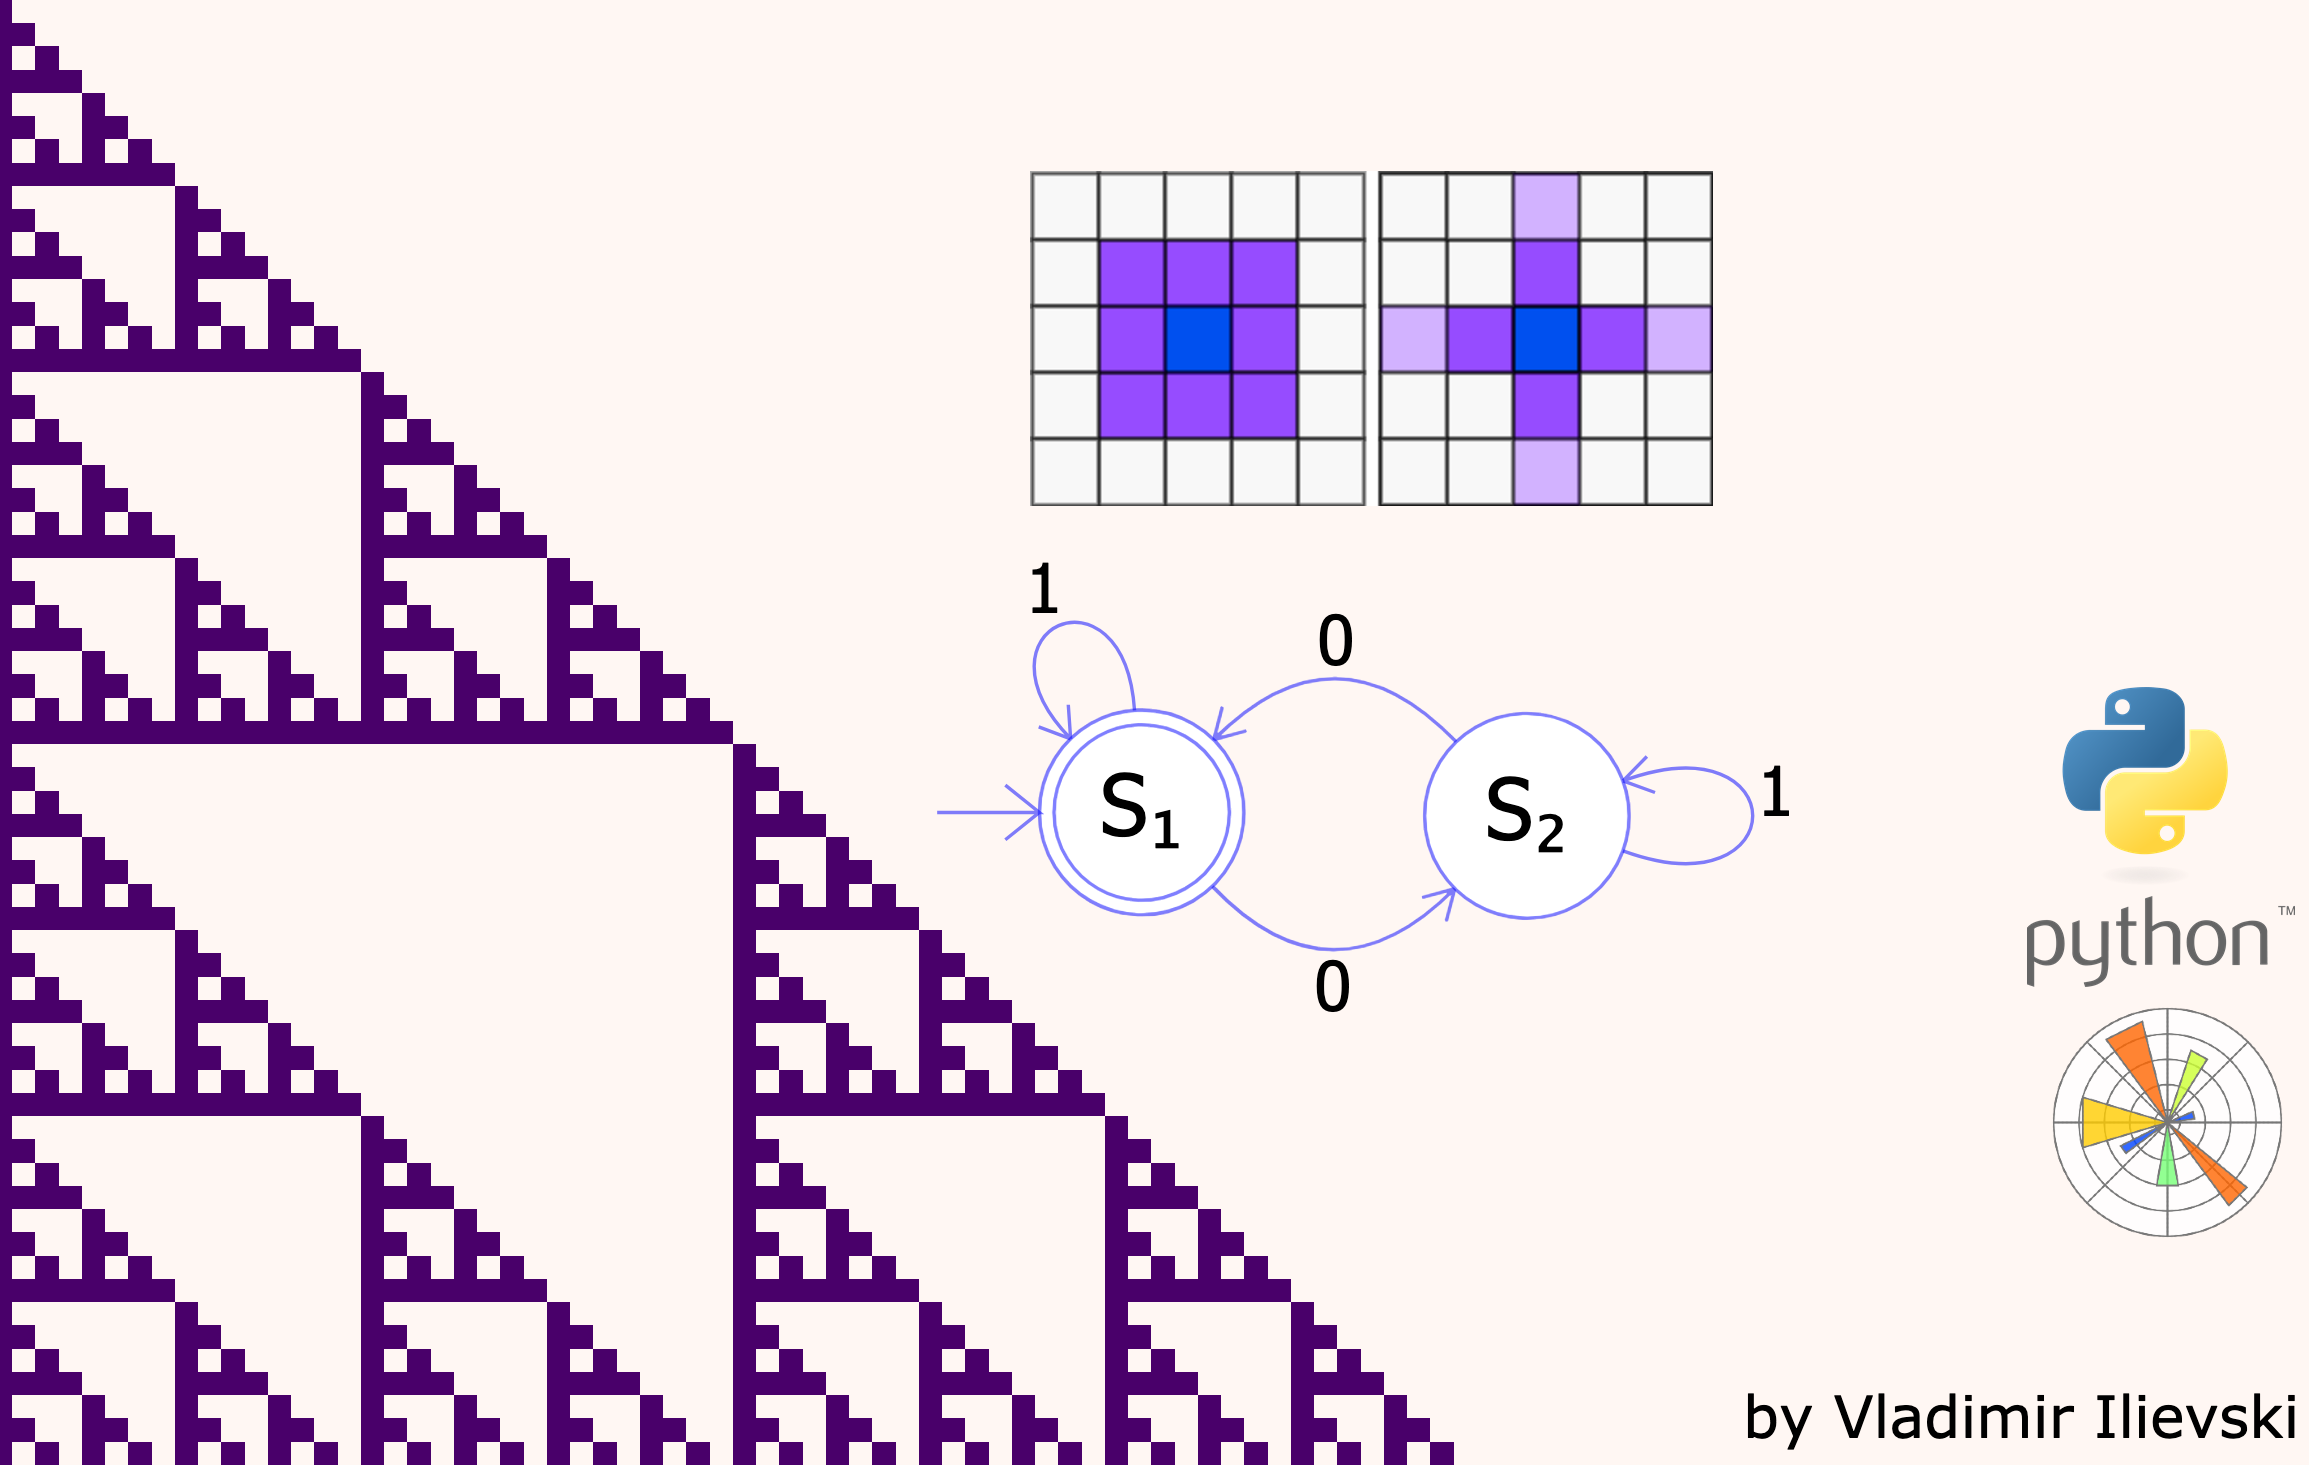
Simple but Stunning: Animated Cellular Automata in Python
Illustration, implementation and animation of elementary cellular automata in Python with Matplotlib.
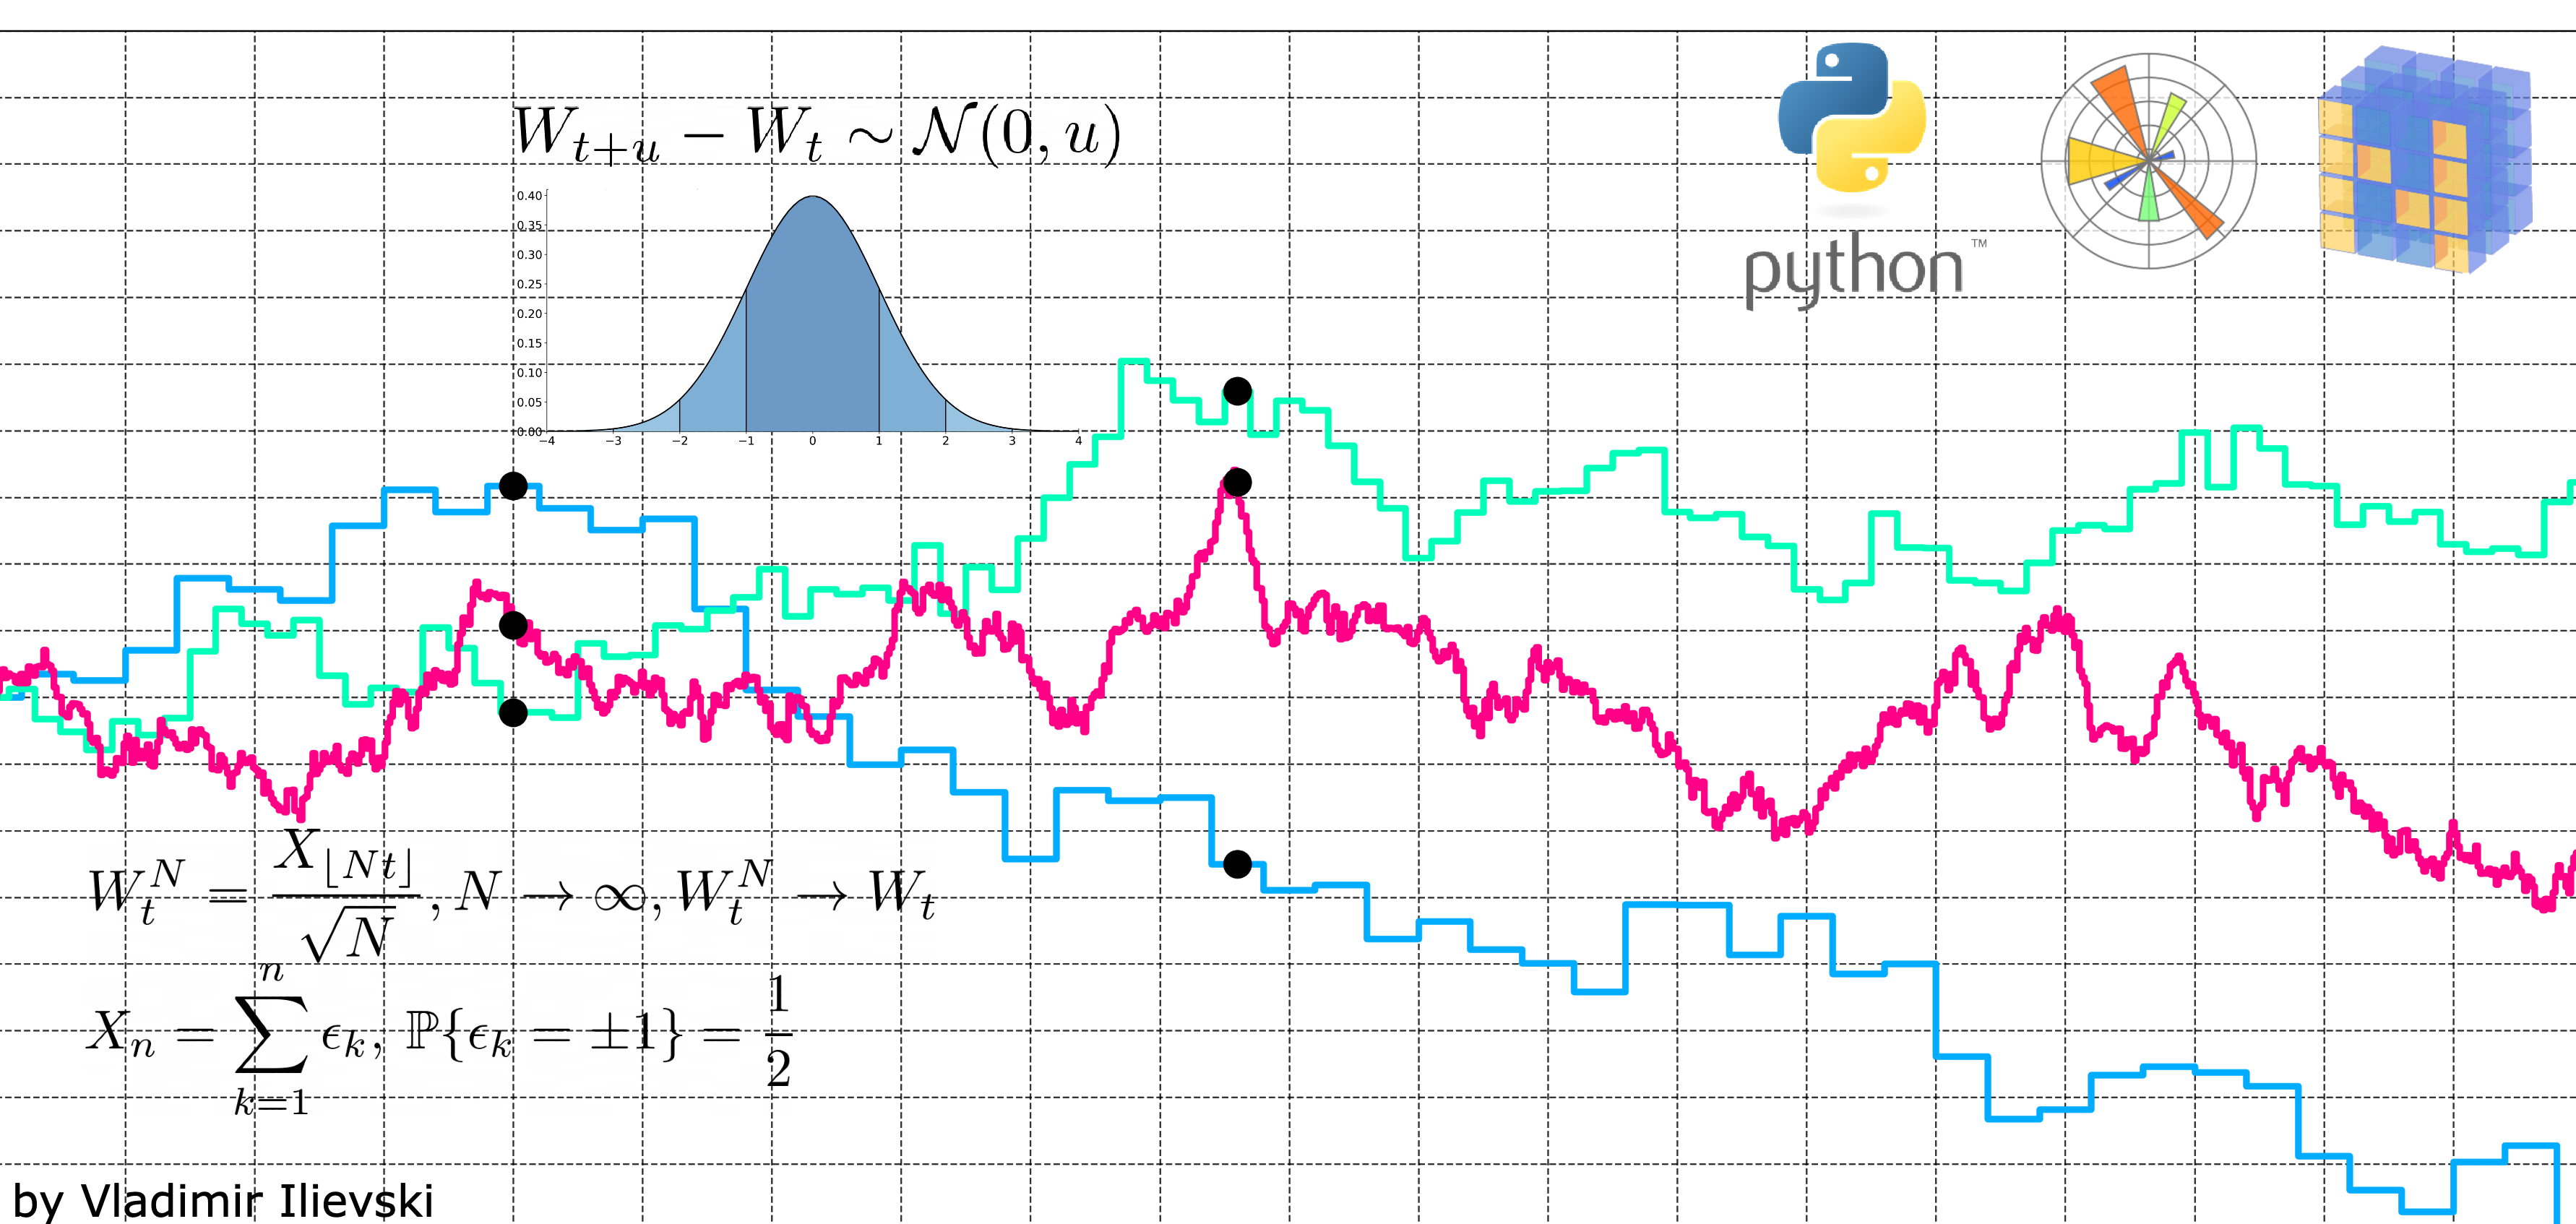
Animated Visualization of Brownian Motion in Python
Tutorial on Brownian Motion using Matplotlib to animate the construction step by step.
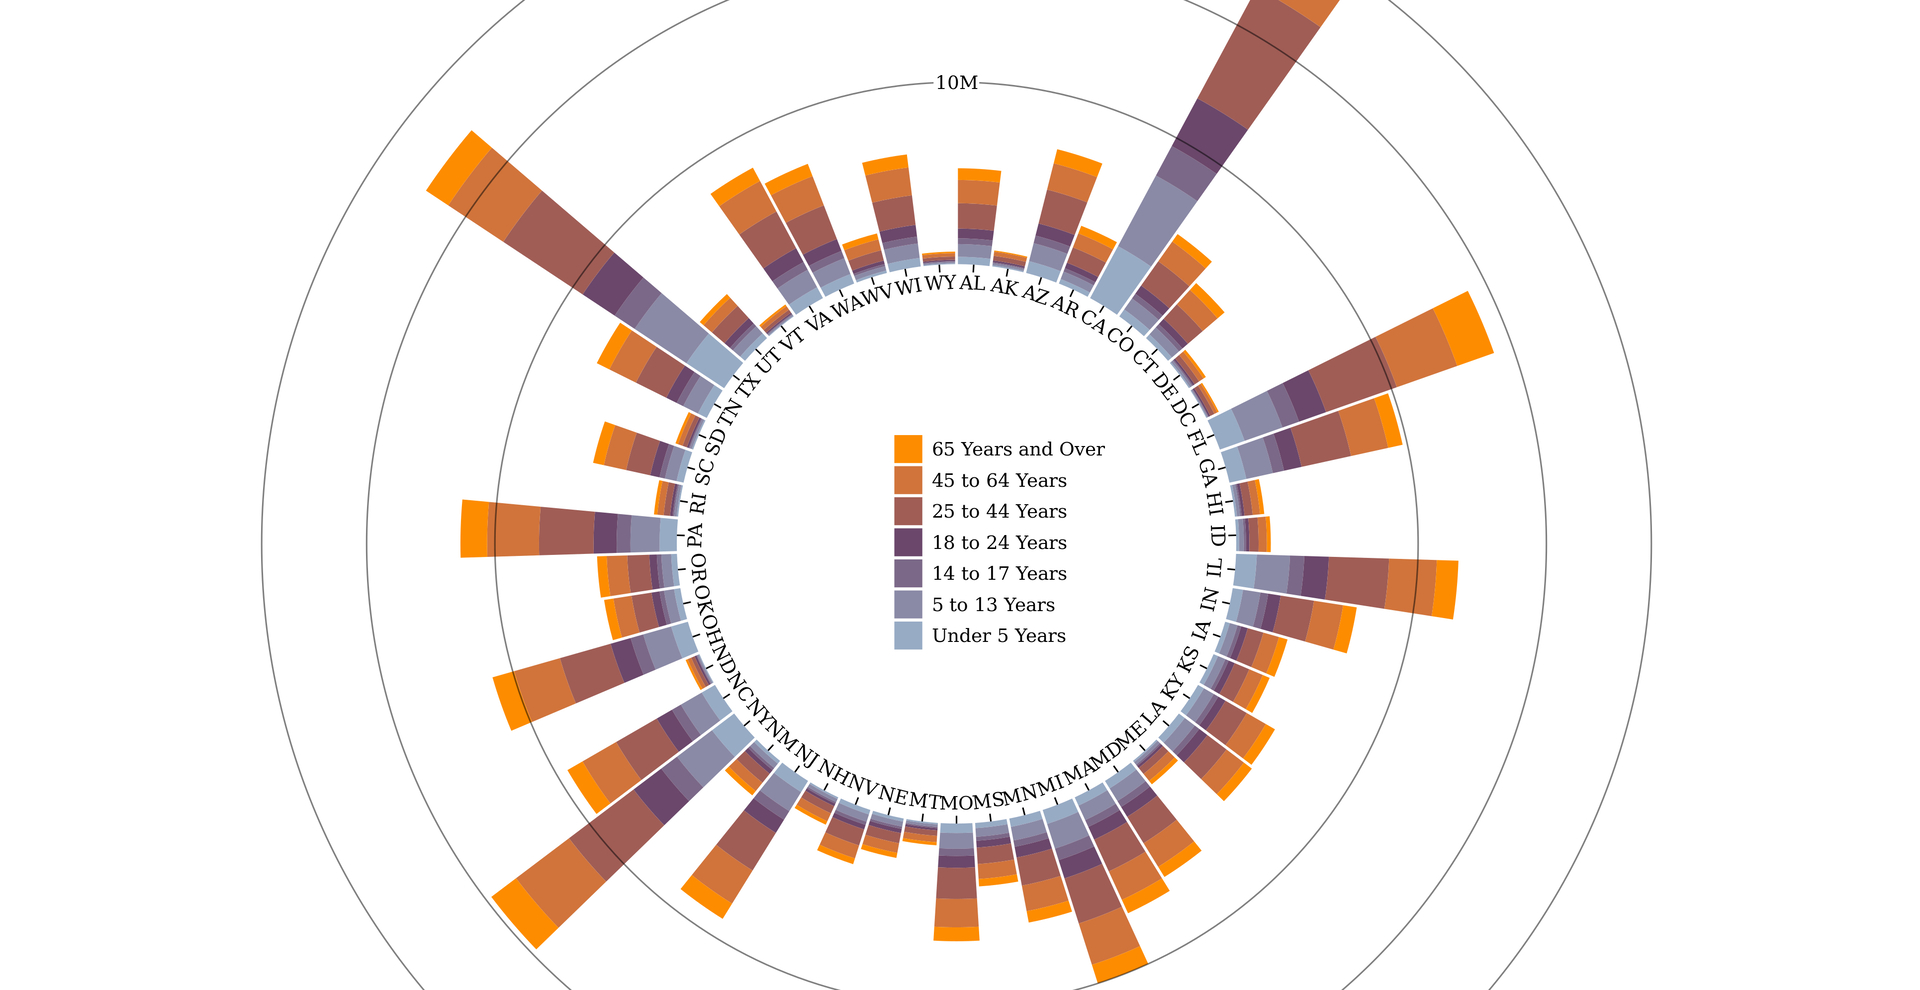
The importance of interactive data visualization
Hands-on D3.js: building a Parallel Coordinates plot from scratch with a live demo.
Featured visualizations
Hand-picked visualizations to play with.
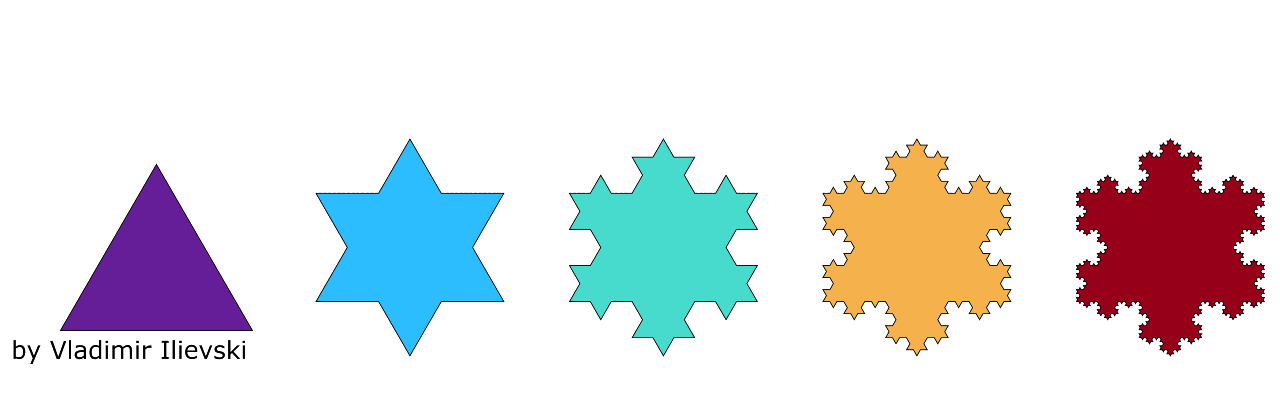
Koch Snowflake in Python with Matplotlib
Implement the Koch Snowflake in Python and animate it with Matplotlib.
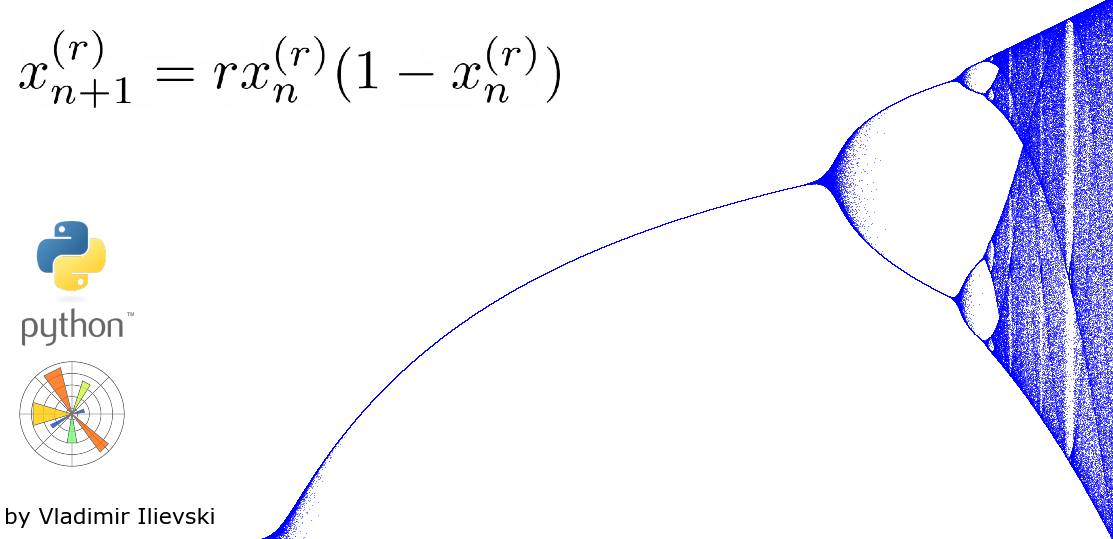
Chaotic Beauty: Bifurcation Diagram
Visualize the bifurcation diagram of a simple logistic map with Matplotlib.
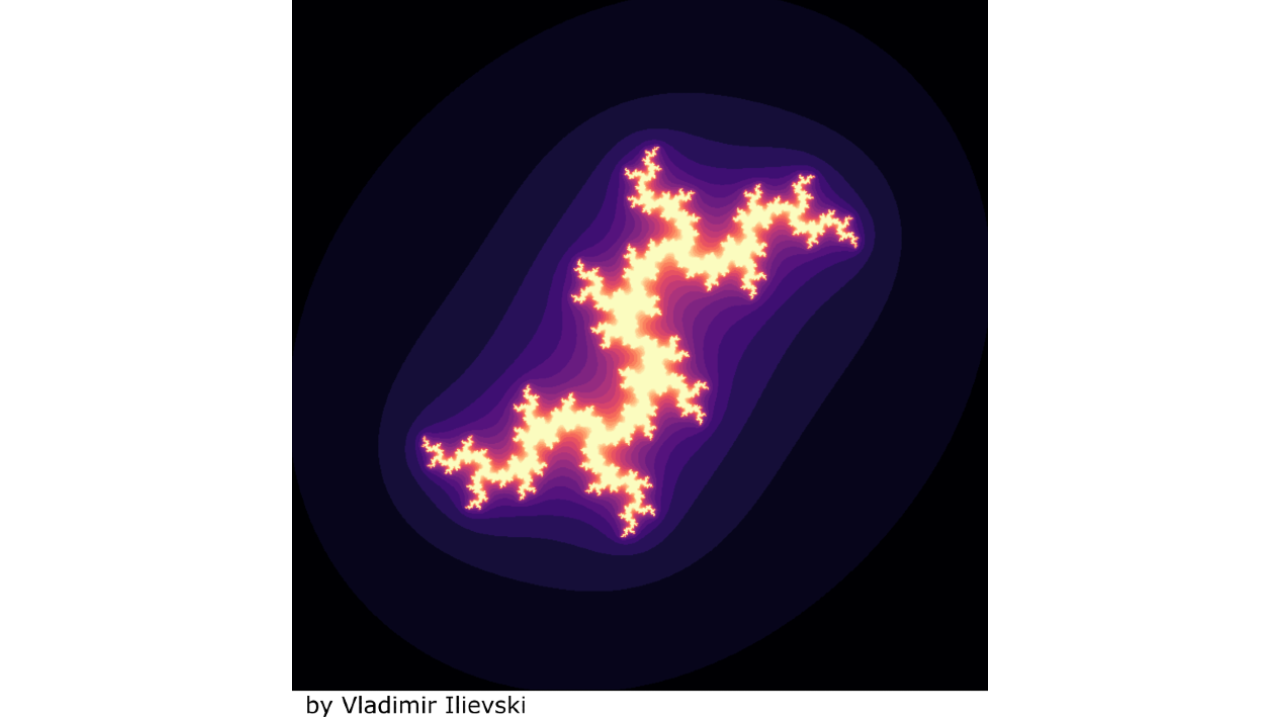
Julia Set: Animate your own
The mind-bending properties of the Julia Set through the prism of visualization.
About iSquared
iSquared is a place to perceive science through interesting visualisations. Each piece explains the concept, implements it in code, and shows it in motion. The goal: make ideas easy to grasp.
Curious about the author? Head over to the $whoami page.
Stay in the loop
Get new posts, visualizations and tips straight to your inbox — no spam, ever.